1. This blog shows you how to provide data for OOB Charting Web part in Sharepoint 2010. First insert the chart web part into you page as shown in fig. below

2. Create custom web part and specify the database connection as I am retrieving chart data from sql server 2008 database. Copy paste following code into webpart and deploy web part to site collection
[ToolboxItemAttribute(false)]
[Serializable]
[AspNetHostingPermission(SecurityAction.Demand, Level = AspNetHostingPermissionLevel.Minimal)]
[AspNetHostingPermission(SecurityAction.InheritanceDemand, Level = AspNetHostingPermissionLevel.Minimal)]
public class ChartDataProviderWebPart : WebPart, IWebPartTable
{
SqlDataAdapter sda;
Timer _timer;
DataTable _table;
Label _lblMessage;
string databaseConnectionString = "Data Source=.;Initial Catalog=Demo_Database;user id=username;password=yourpassword;"; // Change setting
protected override void CreateChildControls()
{
// Timer control added to refresh chart after every 30 second
_timer = new Timer();
this._timer.Interval = 30000;
this._timer.Tick += new EventHandler<EventArgs>(_timer_Tick);
this._timer.Enabled = true;
this.Controls.Add(this._timer);
this.Controls.Add(this._lblMessage);
}
void _timer_Tick(object sender, EventArgs e)
{
this._lblMessage.Text = string.Format("Last updated @ {0} ", DateTime.Now.ToString());
}
public ChartDataProviderWebPart()
{
try
{
_table = new DataTable();
this._lblMessage = new Label();
this.sda = new SqlDataAdapter("select * from tblData order by name", new SqlConnection(this.databaseConnectionString));
this.sda.Fill(this._table);
}
catch (Exception ex)
{
this._table.Columns.Add(new DataColumn("Name"));
this._table.Columns.Add(new DataColumn("Value"));
}
}
public void GetTableData(TableCallback callback)
{
callback(_table.Rows);
}
public PropertyDescriptorCollection Schema
{
get
{
return TypeDescriptor.GetProperties(this._table.DefaultView[0]);
}
}
public bool ConnectionPointEnabled
{
get
{
object o = ViewState["ConnectionPointEnabled"];
return (o != null) ? (bool)o : true;
}
set
{
ViewState["ConnectionPointEnabled"] = value;
}
}
[ConnectionProvider("Table", typeof(DataTableProviderConnectionPoint), AllowsMultipleConnections = true)]
public IWebPartTable GetConnectionInterface()
{
return new ChartDataProviderWebPart();
}
}
public class DataTableProviderConnectionPoint : ProviderConnectionPoint
{
public DataTableProviderConnectionPoint(MethodInfo callbackMethod, Type interfaceType, Type controlType, string name, string id, bool allowsMultipleConnections)
: base(callbackMethod, interfaceType, controlType, name, id, allowsMultipleConnections)
{
}
public override bool GetEnabled(Control control)
{
return ((ChartDataProviderWebPart)control).ConnectionPointEnabled;
}
}
3. Go to page where you inserted chart web part, insert above deployed webpart on same page. Click on Data & Appearance from chart web part -> Click on Connect Chart To Data
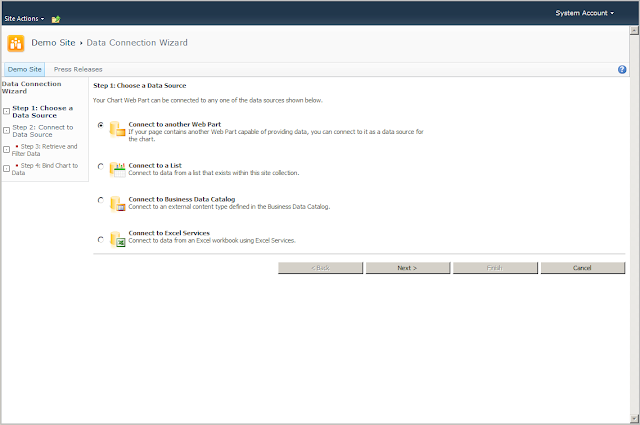
4. After clicking on Connect Chart To Data you got Step by Step Data Connection Wizard
- Step 1: Choose Connect to another web part option for this step and click on Next button
- Step 2: Connect to another Web Part in drop down you found the name of web part that you deployed now
- Step 3: On retrieve data step select Table as source data format in data format dropdown and click on next button
- Step 4: On Bind Chart to Data , set Y Field to "Value" and X Field to "Name" as shown in fig. below and click on Finish
- This web part refresh after evey 30 second for retriving data from database.


No comments:
Post a Comment